Weekend Update #116


Welcome to Blue Room's Weekend Update. Each week, we're sharing what companies we're researching and the what, the who and the how that we think makes the companies interesting and unique. This roundup is brought to you weekly by a group of interns, creative minds, artists and investors who believe that through best in class investing along with the democratization of financial education we can do great things together. Enjoy, Explore and Share.

After three consecutive weeks of negative performance, the S&P and Dow Jones indexes reversed course this week, generating returns of 1.90% and 1.75%, and ending at $4,045.64 and $33,390.97, respectively.
The week started off on shaky footing for stocks thanks to the “good news is bad news” dynamic that has resulted from the Federal Reserve’s commencement of monetary tightening early last year. Last week, CPE—the Fed’s preferred inflation reading—came in at 5.4% for January, hotter than the expected 5.0%, while personal spending came in at 1.8%, exceeding expectations of 1.4%. Market participants tend to believe strong economic data like this gives the Fed rationale to continue raising rates, and holding them higher for longer, which is bearish for stocks. To wit, traders are now pricing a peak rate of 5.4% this year, up from 5% just a month ago. However stocks rallied at the end of the week following Atlanta Fed President Raphael Bostic’s comments Thursday suggesting the Fed could possibly pause its rate hikes this summer.
Pending home sales came in higher than expected as well, registering an 8.1% uptick in January, reflecting an increase in demand arising from price cuts and consumers taking advantage of a recent downswing in 30-year mortgage rates, which reached a low of 6.4%, down from an October peak of 7.22%. In the midst of this positive economic data was the bond market, where the 10-year Treasury yield pierced the 4.0% level earlier in the weak, and the 2- and 10-year spread continued its widening, reaching nearly –91 basis points, the widest this measure has been since 1982, when it reached –72 basis points. Yield curve inversion have historically tended to precede economic recessions by several months.
On the earnings front, several companies reported, among them key players in the software and retail industries. Zoom beat EPS and revenue estimates following continued to demand for its video conferencing service as companies shift to work-from-home and continue to cut costs and find operational efficiencies. Workday similarly saw strong demand for its enterprise cloud solutions which led to 20% year-over-year growth in revenue. Salesforce beat on both EPS and revenue and provided a better-than-expected Q1 guide, propelling its stock 14%. Target benefited from sales of household essentials but revealed shrinking profits and a cautious fiscal year outlook. Costco beat EPS estimates yet missed on revenue, citing lessening demand for discretionary items as consumers reined in spending. Other companies that reported this week include Kroger, Schrödinger, Ambarella, Best Buy, ChargePoint and Compass Pathways. Find this and more in this week’s Blue Room Newsletter.
Friday’s Close
S&P 500 4,045.64 +1.61%
Dow Jones 33,390.97 +1.17%
Nasdaq 11,689.01 +1.97%
Key Economic Readings Next Week
Wednesday, March 8 — ADP Employment Change; JOLTS Job Openings
Friday, March 10 — Change in Nonfarm Payrolls (BLS); Unemployment Rate, Average Hourly and Weekly Earnings, Labor Force Participation Rate, Underemployment Rate
Thank you Blue Room Team Leader OMAR GUZMAN

Summary
In the fourth quarter of 2022, Compass Pathways commenced its COMP360 Phase 3 pivotal programs in Treatment Resistant Depression, which represent the first-ever Phase 3 trials of psilocybin.
In its latest earnings release, the company revealed it generated a net loss of $91.5 million in 2022, a 27.5% year-over-year decrease. The company spent $65.1 million on R&D expense and $45.4 million on G&A expense, for a total of $110.4 million in total operating expense in 2022—a 33% increase over the prior year’s $83.2 million. These increases are attributable to the company’s research in COMP360 psilocybin therapy in clinical and pre-clinical trials, as well as an increase in headcount as well as in legal and professional fees.
The company’s cash position at the end of December 31, 2022 was $143.2 million, as compared to $273.2 million in 2021. Compass’ trailing twelve month cash burn was $106.1 million. Given this run rate, the company thus has 1.4 years left of cash runway, meaning it has about the middle of 2024 to generate cash. However, if the company is able to manage its operating expense to a rate seen in early 2022—$77.4 million, before it was preparing for its pivotal Phase 3 programs—its runway becomes 1.9 years and extends to the end of 2024.
Coincidentally enough, the company said that after completing further analysis of its Phase 2b data related to the 1-mg arm as well as a University of Zurich placebo-controlled study, the company was able to re-estimate its sample size to 255 from 378, which brings forward the company’s expected completion date of its six-week primary endpoint to summer 2024 instead of end of 2024.
Further, the company is submitting protocol amendments to the FDA which integrate follow-ups in the two pivotal trials. Both COMP005, a single 25-mg dose, and COMP006, a fixed repeat dose (25-mg, 10-mg and 1-mg)—will be given the option of retreatment in Parts B and C of the trials—between Week 6 and Week 26, and between Week 26 and 52, respectively. The company believes these amendments will help to generate further evidence that enhances their Phase 3 program (and will be needed by payers for reimbursement of the new therapy upon launch).
The company also disclosed that it participated in a meeting in February focused on the final stages of the reimbursement code process, and they hope to have the new tracking CPT code available soon, and that this will serve as the precursor to the final commercial code.
Management was asked about the cash runway during the earnings conference call and they said they have a variety of options should they need to raise additional cash, including: an equity offering with biotech investors that have expressed interest; utilizing their ATM program; potentially taking on debt, and of course, implementing cost discipline on the operating side.
The company has not yet dosed patients as they are still completing site selection as well as completing the patient screening process.


Blue Room Analyst Takeaways
Ambarella fourth quarter revenue came inline with expectations that were anchored to previous quarter guidance (third quarter in a row where guidance = actual results). For the fourth quarter P&L:
Revenue of $83.3 million beat BLUE ROOM expectations of $82.8 million
Adjusted GM of 62.6% came in line with BLUE ROOM expectations of 62.5%
Net Income of $(11.1) million beat BLUE ROOM expectations of $(23.0) million
The deviation between BR expectations and the actual results was a ($10.0) million dollar tax benefit from operating in multiple tax jurisdictions
Diluted EPS and adjusted EPS of $(0.29) and $0.23, respectively:
Beat BLUE ROOM expectations of $(0.56) and $0.19;
and beat consensus expectations of $(0.57) and $0.14.
Although fourth quarter results outperformed, the stock fell post-market on weaker-than-expected first quarter guidance. Continued sell-in challenges with customers as a result of the recalibration of end demand, specifically in the IoT end market, seem to be more severe than originally feared. This is an issue that will carry itself through 1Q24, with lower recognizable revenues contributing to a decrease in gross profit by $19 million, and a compression of gross profit margin of 244 bps (in our preliminary model analysis). According to management, customers are indicating healthy levels of end-demand, but they are still aggressively managing down inventory. This results in a slowdown in bookings, a figure that is not reported but is likely down by 30 points according to a datapoint provided during the call. That leads us to believe that sell-in will rebound once the industry-wide inventory correction subsides, which should occur in the second half of calendar year 2023, according to market research and market participant feedback. We are also constructive on the expansion of CV3’s end-markets with 4D radar processing design wins in the quarter.
While the first quarter outlook disappoints, Ambarella still expects a now 5-year automotive pipeline of ~$2.3. Implications for software revenues to impact the P&L in FY26/FY27 allows us to continue being constructive on the long-term. Software ASPs are currently outlined to be $700 per CV3-AD chip shipped, which will be accretive to margins in the long-run. [PT: $131]


Q4 Recap
Zuora reported better-than-expected quarterly results as buyer behavior began to stabilize as its install base returned to making commitments on volume and additional products, and most deals that were pushed in Q3 ultimately closed in Q4. Further, the cohort of customers paying over a million dollars a year grew by over 33% compared to the previous year, and the company saw the lowest churn rates in their history. There was some additional softness in EMEA, but the company feels good about its position and execution in the region. Overall, Zuora’s land and expand strategy is working well, with products released in the last 18 months contributing to over 20% of new deals. In addition, roughly 80% of all new business deals were partner-influenced, with partner-sourced new business deals having a 3x larger deal size and 3x better close rate. Zephr’s integration with Zuora’s platform has also been smooth so far, as the team is beating its targets and its ARR is 35% larger than when the deal was announced.
Microsoft
Microsoft is a Zuora customer across several of its business units and is now using Zuora's cloud SSP analyzer, an important component of our Zuora Revenue product. In addition, Zuora integration with Microsoft’s Azure platform, through a previously announced partnership, now allows the company to expand its reach to Microsoft’s reseller base, and Azure customers are even able to pay for Zuora services with Azure credits. With Zuora already integrated on AWS, it is now a multi-cloud environment that can meet customers where they are.
Outlook
Looking forward, the revenue guidance at the midpoint came in-line with consensus for Q1 and beat on consensus for the full year, while non-GAAP operating income and EPS came in higher for both. Q1 has three fewer days than the previous quarter, which creates a headwind of approximately $3 million of subscription revenue. The company achieved $365M in ARR from the previous quarter, and will only need to generate $9M in incremental revenue in order to achieve the low end of guidance it set for the year. The company expects to generate positive non-GAAP operating income on a quarterly basis going forward, with a minimum of 6% operating margin for the year. Finally, the free cash flow guidance of $24M is a $55M swing from the -$31 from last year. The company plans to also provide additional customer metrics on the next earnings call, likely providing new data for its Revenue and Collect products which have grown to be material revenue drivers.


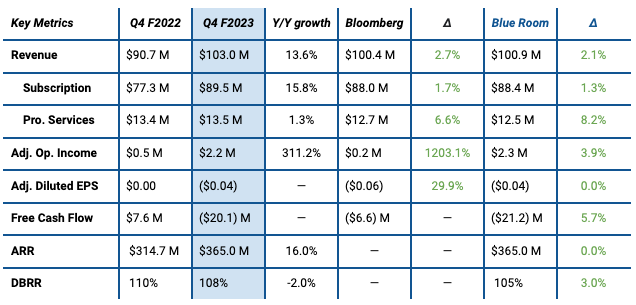
Schrödinger’s upside to consensus estimates on Q4 2022 revenue and net loss, combined with positive commentary on FY 2023 OpEx discipline as well as the anticipated inflection in Drug Discovery revenue, were very positive for the outlook. SDGR stock closed on Wednesday at $24.60 (+13.2%) following the earnings release.
Management guided to $70-90 million in Drug Discovery revenue for FY 2023 but mentioned multiple shots on goal to exceed the $100 million target they set out to achieve last year. Those include possible partnering of more mature internal drug candidates as well as continued strong execution on collaboration milestones in the year ahead.
Not only did the number of customers over $100,000 continue to grow at 19.5% YoY but the ACV of customers over $100,000 accelerated 28.6% YoY to 82% of total ACV and the average contract size per customer grew at 7.6% YoY. Customers with annual contracts over $5 million doubled from 2 to 4 in 2022, and commentary was very bullish about the potential magnitude and timing for this uptake in large-scale deployment of Schrödinger software to occur.
Following the cash distribution from Takeda for their acquisition of Nimbus’ TYK2 inhibitor — a company Schrödinger co-founded and holds a 3.8% equity stake — cash runway is sufficient to fund operations into the foreseeable future. =


This past month saw notable moves in the oil market with respect to supply, especially on the part of OPEC+ and Russia. Both will have tremendous implications for the global balance of oil over the course of the year. With regard to natural gas, prices continued their downward trend – dropping as much as 80% below the highs reached in August as the U.S. faces a large domestic supply glut. But before diving into specifics, it is important to consider what the largest voices in the oil market have been saying about their expectations for supply and demand.
OPEC’S monthly oil market report (MOMR) did not radically change from their previous estimate. Nonetheless, they did incorporate upward revisions for demand as output continues to defy expectations. Specifically, in their February MOMR, OPEC raised their forecast for oil demand for this year by 100,000 barrels per day. This stronger-than-anticipated economic growth is largely driven by the U.S. and Europe, who were showing resilience in the face of elevated interest rates and continued inflation. In addition to large Western consumers, China also played a major role in the demand increase, due to the ripple effect that their economy is expected to create on global growth. Specifically, OPEC raised its forecast for economic growth from 0.4% to 0.8% and from 1.0% to 1.2% for the Eurozone and the U.S., respectively. For China, OPEC’s estimate increased from 4.8% to 5.2%.


Q4 Recap
For Q4 2022, Vimeo came in ahead of expectations, with a large positive surprise in operating margin. The company demonstrated its ability to manage OpEx with a 14% year-over-year decline in non-gaap expenses, and delivered better-than-planned positive adjusted EBITDA and free cash flow for the last 2 quarters, ahead of schedule. Vimeo will stop reporting monthly metrics in 2023, and instead will begin to break out additional metrics for its business segments Vimeo Enterprise, Self-Serve & Add-Ons, and Other.
Vimeo Enterprise
The company’s fastest growing segment, Vimeo Enterprise, is now over 15% of total Vimeo bookings, and in Q4 it grew 59% year-over-year to contribute roughly 10% of revenue in 2022. Vimeo Enterprise revenue grew 69% year-over-year in 2022, a 6X from 2020, and bookings grew 53% in 2022, with growth accelerating in each of the past two quarters. The company saw its best win rate of 2022 in Q4 and aims to build off of this as the product is expected to continue growing steadily as a percentage of total bookings and revenue. Net revenue retention for Vimeo Enterprise remains above 100% and ARPU is hovering around $20,000, with some deal sizes reaching seven figures, which will make this customer base a key growth driver in the long-term.


Q4 FY23 Earnings:
Total revenue: $1.65B, +19.6% YoY (above high level)
Subscription revenue: $1.50B, +21.7% (above high level)
GAAP Operating Loss: ($89M), Operating margin: -5.4%
Non-GAAP Operating Income: $305M, Operating margin: 18.5% (improving, compared to Q4 FY22 of 17.2%)
Non-GAAP diluted EPS: $0.99
Operating cash flow: $694M
Estimates for Q1 FY24:
Total revenue: $1.668B, +16.3% YoY (Guideline: $1.666 - 1.668B)
Subscription revenue: $1.52B, +19.5% (Guideline: $1.517 - 1.520B)
Non-GAAP Operating Income: $353M, Operating margin: 21.2% (Guideline: 21.5%)
Non-GAAP diluted EPS: $1.09
Estimates for full FY24:
Total revenue: $7.210B, +16.0% YoY (Guideline: $7.155 - 7.225B)
Subscription revenue: $6.565B, +17.9% (Guideline: $6.525 - 6.575B)
Non-GAAP Operating Income: $1.65B, Operating margin: 22.9% (Guideline: 23.0%)
Non-GAAP diluted EPS: $5.09


Blue Room Analyst Takeaways
Revenue (reported) was below expectations although comparable store sales were less negative than our estimates:
Reported revenue down (10.55)% due to domestic revenue decreasing 9.8% and international revenue decreasing 12.2%
Comp. international revenue saw an FX impact of (5.7)%
Comp. sales declined (9.3)% v. our estimates of (10.25)%
Weaker sales in computing, home theater, appliances, and mobile phones (which was expected)
Best Buy experienced lower costs than expected during the quarter, resulting in better reported margins:
Operating margin of 4.34% v. 4.09% estimated
EPS of $2.16 beats BLUE ROOM estimates of $2.16, and consensus of $2.10
Best Buy outlook is far weaker than our initial assumptions of a 2H23 recovery, providing room for upside revision as the year progresses:
"As we enter FY24, the consumer electronics industry continues to feel the effects of the broader macro environment and its impact on consumers,” said Matt Bilunas, Best Buy CFO. “As a result, our outlook assumes comparable sales decline 3% to 6% for the year, with the most sales pressure in the first quarter, as year-over-year comparisons ease through the year.”
BLUE ROOM modeled comp sales growth of 1.76%
Gross profit margin to expand during FY2024:
Gross profit rate (adjusted) to expand 40 to 70 bps
BLUE ROOM modeled GAAP GM expansion of 74 bps
Overall, Best Buy remains a top pick for retail based on the assumption of continued CE growth in the long-run. According to management, average U.S. households now have twice as many connected devices as they did in 2019 and consumers indicate that more of their tech purchases are need-based and not want-based. Additionally, the upgrade cycle for computers and mobile phones have an update cycle of about 3 years, at the low end, and larger appliances and connected home-related products have an update cycle of around 7 years. As we begin to come upon the 5 year anniversary of stimulus spending, Best Buy top-line should see modest growth.
Both the dividend and share repurchase mechanisms lend the stock to appreciation in the long-run, and we lean into Best Buy as a consistent go-to for cash-flow generating operation. Our current price target has room for upside as incrementally more positive operating margin becomes realized after the FY2024 down year. [PT: $75]


At the H.C. Wainwright Cell Therapy Conference, Precision BioSciences management participated in their first investor conference call since September and previewed the upcoming azer-cel allogeneic CD-19 CAR T therapy data update. Management reiterated their confidence in a potential pivotal trial and pathway to FDA approval for the post-autologous CAR T-relapsed patient population and set positive expectations for the CAR T update in late March/early April.
The conference call follows senior leadership and organizational changes announced on February 24, where Derek Jantz, Co-Founder & Chief Scientific Officer, will be stepping away from day-to-day activities in order to pursue family time and other professional interests as he assumes the new role of Chief Science Advisor. It was also announced that Neil Leatherbury has been promoted to Senior Vice President, Head of Chemistry, Manufacturing, and Controls.


Tim Driggers -- Chief Financial Officer
Good morning and thanks for joining us. This conference call includes forward-looking statements. Factors that could cause our actual results to differ materially from those in our forward-looking statements have been outlined in the earnings release. This conference call also contains certain non-GAAP financial measures. Definitions and reconciliation schedules for these non-GAAP measures can be found on EOG's website.
Some of the reserve estimates on this conference call may include estimated potential reserves and estimated resource potential not necessarily calculated in accordance with the SEC's reserve reporting guidelines. Participating on the call this morning are Ezra Yacob, Chairman and CEO; Billy Helms, President and Chief Operating Officer; Ken Boedeker, EVP, Exploration and Production; Jeff Leitzell, EVP, Exploration and Production; Lance Terveen, Senior VP, Marketing; and David Straube, VP, Investor Relations. Here's Ezra.
2022 Q4 Actual Earnings:


Quarter results:
Total revenue $8.38 billion, up 14% y/y, 17% in constant currency
Operating margin 29.2%, compared to 14.96% in Q4’FY22
Q4 GAAP EPS of $(0.10) and non-GAAP EPS of $2.02
Full Year FY2023 results:
Total revenue: $31.4 billion, up 18% y/y, 22% in constant currency
Operating margin 22.5%, compared to 18.69% of FY22
GAAP EPS of $0.21 and non-GAAP EPS of $6.05
CapEx 2.5% of FY revenue
Full Year FY2024 guidance:
Total revenue $34.5 - $34.7 billion, 10% y/y
Operating margin 27%, with Q1’FY25 at least 30%
Stock-based compensation below 9%
GAAP EPS $.59 - $2.61, non-GAAP $7.12 - $7.14
CapEx slightly below 2.5% total revenue
Salesforce had a phenomenal quarter, turning around the narrative of a “mature giant” in a “trough” with myriads of internal issues. They attributed the Q4 beat to Tableau and MuleSoft.
Marc Benioff, Salesforce founder, said they were removing the M&A committee and stop growing through acquisition to really focus on the current product portfolio and improve efficiency. In addition, they are also announcing a 4-days-a-week minimum program of working face-to-face with customers for their sales and service teams.


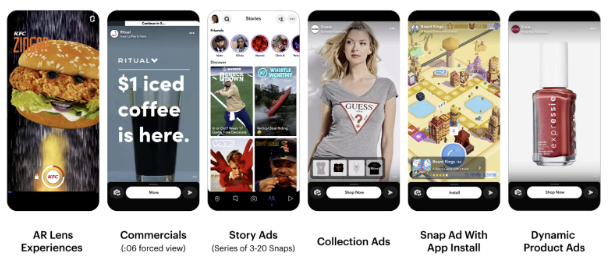
Snap Inc.’s 2023 Investor Day highlighted key achievements from 2022 and previewed some of the upcoming growth opportunities for the company. Over the past year, Snapchat reached 750 million monthly active users — up 20% from the 600 million MAUs reported in April 2022. During the presentation, Snap also set the goal to reach 1 billion MAUs within the next 2-3 years.
The core Snapchat service posts high retention and engagement metrics, with 88% of Snapchatters who Snap or Chat a friend using the app each of the following 7 days. In the U.S., users open the Snpachat app an average of 40 times per day. Longer term, for the 5 years after a user’s first year on Snapchat, their annualized retention is approximately 90%.
Map has reached 300 million monthly active users, and this screen remains one of the biggest potential opportunities for Snap to monetize in the future, along with Spotlight. Snap increased Map engagement by over 100% over the past year by adding new functionality with recommended restaurants and places to visit.
Snapchat+ is an example of Snap diversifying their revenue streams in the face of macro challenges for ad revenue. The service’s launch is off to a great start with over 2.5 million subscribing to the $3.99 per month service just 7 months after its release. Snapchat is not the only believer in social media’s shift to a subscription model with Elon Musk projecting Twitter would reach $10 billion in subscription revenue by 2028, about double Twitter’s $5 billion in sales 2021. Capitalizing on the massive success of ChatGPT, Snapchat+ users are now also able to chat with an avatar form of OpenAI’s ChatGPT directly from the Snapchat app called “My AI” — which are the types of innovations that Snap consistently produces and leads to such high Snapchat engagement and usage.


Blue Room Analyst Takeaways
Revenue declined against the company’s upward revision last quarter due to supply chain disruptions. Revenue cutoff criteria and softer than expected N. America demand were the primary catalysts. Revenue from DC fast charging rollouts were the primary products that were subject to supply chain headwinds. DC fast chargers also come with lower margins until introduction of DC plus stations that will roll out over the coming year. In analyzing the company’s current quarter backlog, the company expects a rapid rebound in revenues.
On the positive, the quarter’s $100m in annual run rate for subscriptions (subscription backlog at $166m) was an all-time high. This led to an all time high subscription revenue per installed port.

Diversification of segments highlighted in billings breakouts show growth in Fleet (bookings are correlated to sales, however do not reflect accruals); Commercial 69%, Fleet 19%, Home* 11%, and Other < 1%.
ChargePoint expects improvement in gross margins, compression of lead times and higher volume after the first quarter of FY2024. The headwind will remain in the first quarter, leading to lower gross and operating margin. The company continues to be bullish on their CF positive in Q4 2024 target.
1Q24 guided revenue below expectations, but should rebound in following quarters. The operating leverage should be positive after 1Q as well on higher volume, lower supply costs, and full sales recognition. [PT: $18.00]

BLUE ROOM
+WEEKLY+
THURSDAY’S GLOBAL ZOOM
—
Thursday
March 2, 2023
12 PM
BLUE ROOM
GLOBAL MEETING #108
———————
Big week of updates!
Agenda
Blue Room Investing
— Emily
— Eli
— Omar
Blue Room Impact
— Housing
— Art
— Grain
Question?
If you had to describe yourself as the combination of two (or more) breeds of dog, which would they be and why? (Bring pictures!)
— thank you Nina for the question.
Bonus question: March is Women’s History Month. Who is your favorite historical figure?


Q4 FY23 Earnings:
Total revenue: $1,118M, +4.3% YoY (above upper guidance)
GAAP Operating Loss: ($130M), Operating margin: -11.6%
Non-GAAP Operating Income: $405M, operating margin: 36.2% (compared to Q4 FY22 of 39.2%)
GAAP diluted EPS: ($0.36)
Non-GAAP diluted EPS: $1.22
Operating cash flow: $212M (18.9% margin), Free cash flow: $183M (16.4% margin)
Estimates for Q1 FY24:
Total revenue: $1,085M, +1.0% YoY (Guideline: $1,080 - 1,085M)
Non-GAAP Operating Income: $376M (Guideline: $374 - 379M), Operating margin: 34.7% (declining, compared to Q1 FY23 of 37.2%)
Non-GAAP diluted EPS: $0.97 (Guideline: $0.96 - 0.98)
Estimates for full FY24:
Total revenue: $4,450M, +1.3% YoY (Guideline: $4,435 - 4,455M)
Non-GAAP Operating Income: $1,606M (Guideline: $1,606 - 1,626M), Operating margin: 36.1%
Non-GAAP diluted EPS: $4.17 (Guideline: $4.11 - 4.18)


F
U
N
D
O
N
E
IS LIVE


10% OF ALL BLUE ROOM REVENUES GO DIRECTLY TO FUND OUR NON PROFIT TOGETHERISM.
WE CAN ACCOMPLISH ANYTHING TOGETHER.
These materials do not purport to be all-inclusive or to contain all the information that a prospective investor may desire in considering an investment. These materials are intended merely for preliminary discussion only and may not be relied upon for making any investment decision. Any discussion or information contained in this presentation does not serve as a receipt of, or as a substitute for, personalized investment advice from Blueroom or your advisor.
This publication does not constitute an offer to sell or a solicitation to buy any securities in any fund, market sector, strategy or any other product. Investing is speculative and involves substantial risks (including, the risk of loss of the investor’s entire investment). Past performance is not indicative of future results, and there can be no assurance that the future performance of any specific investment, investment strategy, or product will be profitable.
For more information about us and our general disclosures contact us directly.